This study was conducted to assess the association between nutritional status and blood pressure in apparently healthy school children 7-12 years of age in Ethiopia.
Background: Hypertension carries significant morbidity and mortality if not identified early and treated. Because of lack of awareness, many children develop end organ damage if hypertension is not detected and treated early. Nevertheless, little is known about the association between nutritional status and hypertension among children in Ethiopia. Hence, this study was conducted to assess the association between nutritional status and blood pressure in apparently healthy school children 7-12 years of age.
Methods: A cross-sectional survey was conducted between March and May 2013 in randomly selected 701 apparently healthy school children aged 7-12 years in three public schools in Addis Ababa, Ethiopia. Data were collected on demographic characteristics, anthropometric and blood pressure measurements. Collected data were cleaned for incompleteness and inconsistence using SPSS version 20. Binary logistic regression was used to assess association between outcome variable and predictors.
Results: 105 children (15 %) were underweight, 2.7% and 2.1% were overweight and obese respectively. 77 (11%) of the children were stunted. 25 (3.6%) had diastolic hypertension but none had systolic hypertension. 25 children (3.6%) had pre-hypertension, among which two children had systolic pre-hypertension. Five children with underweight (4.8%) and four (5.2%) stunted children had hypertension. Males and females have an equal risk of high blood pressure. The mean diastolic blood pressure in underweight children was 59.7 mmHg and increased to 68.3 mmHg in obese children. The mean systolic blood pressure in underweight children was 87.6 mmHg and increased to 95.4 mmHg in overweight children but there is no statistically significant difference. There is a tendency of lower mean systolic and diastolic blood pressure in malnourished children. Binary logistic regression analysis shows that there is no statistical significance association between nutritional status of children and hypertension.
Conclusion: Hypertension is not an uncommon problem but it is not associated with underweight or stunting among school children in this cohort. It is emphasized that a blood pressure check-up is important to identify hypertension early with children for timely treatment. Underweight is a public health problem in the studied subjects and large scale nutritional assessment is required for public health measures.
Key words: high blood pressure, underweight, stunting
Damte Shimelis (MD) 1, Wondimu Ayele (MSc) 2, Amha Mekasha(MD,MSc)1
1. School of Medicine, College of Health Sciences, Addis Ababa University, Ethiopia
2. School of Public Health, College of Health Sciences, Addis Ababa University, Ethiopia
There are varied reports on the prevalence of hypertension in children ranging from 1.2-21% (2-4). Hypertension is one of the chronic conditions in children that carry significant morbidity and mortality if not identified early and treated. Because of lack of awareness, less attention is given to this chronic problem and many children develop end organ damage. Most young children have an obvious cause for the hypertension but older children mostly have essential hypertension where the cause is unidentified. Studies have shown positive correlation between obesity and hypertension but there are controversial reports concerning the association between underweight or thinness and hypertension (5-6). Few studies have examined underweight and its association with blood pressure (BP) among children in developing countries. Malnutrition is a common problem among school children in Ethiopia (7). However, little is known about the association of nutritional status with blood pressure among school children in Ethiopia. Hence, the present study intends to assess nutritional status and its association with the level of blood pressure among school children in Addis Ababa.
The study was conducted at 3 randomly selected public primary schools out of the existing 16 schools in the shanty town of Addis Ababa, Gulele Sub-city. The population in the sub-city is predominantly poor in its socio-economic status.
Source population consisted of 2028 students from 2nd to 6th grade whose age was 7-12 years. The sample size was estimated based on the assumption of 5% prevalence of hypertension in school children (4) and 1% marginal error, 95% confidence limits yielding an estimated sample size of 690. General physical examination was done by the investigators and any child who was apparently sick was excluded from the study.
Measurements
Weight and height:
Weight was taken during regular school days. Participants were weighed with no shoes and wearing light clothes using Secca Alpha model 770 electronic weighing scales to the nearest 0.1 kilogram. The accuracy of the scale was checked with a standard weight. Heights were measured in centimeters using a locally produced stadiometer. Body mass index was calculated using the formula weight in kilogram divided by the square of height (m2). Children with BMI less than the 5th percentile for age and gender are classified as underweight (thin) and BMI > 85th percentile for age and gender and >95th percentile for age and gender are classified as overweight and obese respectively (7). The height was compared with the percentile curve developed by the National Center for Health Statistics (NCHS) 2000 and if the height for age and gender is < the 3rd percentile the child is classified as stunted.
Blood pressure
Children were placed in sitting position on a chair with their right hands fully exposed, extended and resting on a table at the level of the heart. Two trained nurses measured three blood pressure recordings in accordance with the recommendations of the National High Blood Pressure Education Program Working Group on High Blood Pressure in Children and Adolescents (3), in sitting position using a standard aneroid sphygmomanometer. Blood pressure cuff was completely deflated in between the measurements. Blood pressure cuff size is chosen based on right mid upper arm circumference. A cuff bladder length which covers 80-100% of the arm circumference and cuff bladder width which is at least 40% of the arm circumference was used. Blood pressure was taken after at least 5 minutes of rest of the child and at least one-minute intervals between measurements. Systolic blood pressure was taken as the appearance of the Korotkoff sound and diastolic blood pressure was taken as the point of disappearance of the Korotkoff sound.
The interpretation of the BP measurements is according to the Seventh Report of the joint national Committee on Prevention, Detection, Evaluation, and Treatment of High Blood Pressure (3). Pre-hypertension is defined as when the mean systolic or diastolic blood pressure or both as compared to the standard curve for age, sex and height is between 90 and 95th percentile.
Hypertension is defined as mean systolic or diastolic blood pressure or both as compared to the standard curve for age, sex and height lying above or equal to the 95th percentile.
Data management and statistical analysis
The collected data were checked for completeness and accuracy and corrected on daily basis before leaving the school. The data were entered, cleaned, and coded and checked for missing value, outlier and inconsistencies and analysis carried out with SPSS version 20.0. The internal consistencies (reliability) of three diastolic and systolic blood pressure measurements were evaluated using Cronbachs Alpha. Bivariate logistic regression was used to measure association of each covariate with outcome variable. Factors that were associated with outcome variable at 20 percent significance level were included in the multivariate analysis. Binary logistic regression with likelihood ratio test was used to identify important predictor variables. The results of the final model were expressed in terms of Odd Ratio (OR) and 95% confidence intervals (CI) and Statistical significance was declared if the P-value is less than 0.05.
Ethical consideration: Permission was obtained from Urban Development Office of the Gulele sub -city and support letter was obtained to the heads of the three primary schools. Informed consent was also obtained from parents. Ethical approval was obtained from Addis Ababa University College of Health Sciences Institutional Review Board.
There were a total of 701 students among which 450 (64.2%) and 251 (35.8%) children were female and male respectively. 284 (40.5%) were between 7-9 years of age and 417 (59.5%) were between 10-12 years. As shown in (Table 1) 563 (80.3%) were normal in terms of BMI, 105 (15%) were underweight (BMI < 5th percentile), 77 (11%) were stunted, 15 (2.1%) were obese and 18 (2.6%) were overweight. Females are heavier than males but there was no difference between females and males in terms of their age and height.
The mean systolic and diastolic blood pressure for both sexes was 91.1(SD 8.2) and 62.1(SD 8.4) mmHg respectively. The mean diastolic blood pressure in underweight children was 59.7 mmHg and it increased to 68.3 mmHg in obese children. The mean systolic blood pressure in underweight children was 87.6 mmHg and increased to 95.4 mmHg in overweight children but there is no statistically significant difference. There is a tendency of lower mean systolic and diastolic blood pressure in malnourished children. In this study the internal consistencies (reliability) were 0.942 and 0.948 for three diastolic and systolic blood pressure measurements respectively (Table 2). Overall 25 (3.6%) of the children had diastolic hypertension but none have systolic hypertension. Twenty five (3.6%) children had pre-hypertension among which two children (0.3%) had systolic pre-hypertension (Table 3).
The highest systolic blood pressure recorded was 116.6 mmHg while the highest diastolic blood pressure was 90 mmHg. There is no significant difference in blood pressure measurement between males and females. The crude and adjusted odds ratios for the associations between high blood pressure and demographic/physical characteristics are as shown in table 3.There is slight difference for age distribution and HBP. Children with the ages between 10-12 years have a slightly higher risk of having HBP than children between 7-9 years (AOR=1.20; CI: .52, 2.76) but this is not statistically significant (p>0.05).Males and females have almost an equal risk of HBP (AOR =.97, CI: .42, 2.25). Obese children are twice at risk of having hypertension (AOR=2.11; CI: .26, 16.98) but this is not statistically significant. Underweight is not a risk factor for hypertension (p >0.05) (Table 4).
In this study, 3.6% of the studied subjects were hypertensive. This prevalence is lower than previous studies from different settings among children 7-12 years of age (8-12). This could be explained by the fact that the prevalence of obesity and overweight is much lower in our subjects than the previous reports.
In our study there is no statistically significant association between underweight or thinness and the risk of developing high BP among school children. Similar finding was reported from South China that revealed no significant association between thinness and pre-hypertension or hypertension (5).
In this study diastolic blood pressure > 95th percentile accounted for all the cases of hypertension among the study subjects. A Brazilian study showed that malnourished and recovered children from malnutrition do have a statistically significant higher mean diastolic blood pressure than the controls (6). The Danish study has also shown high protein intake during early life would significantly decrease blood pressure records in later life (13). Since our study is a cross sectional study, underweight or thinness and hypertension were assessed at a single point in time; therefore it is not possible to elucidate whether hypertension preceded or resulted from malnutrition.
On the other hand, stunted children seem to have a higher blood pressure record than normal children although binary regression analysis was not statistically significant. This could be explained by the fact that the outcome variable in our context was low as compared with other studies.
This study showed a positive correlation between blood pressure records and anthropometric measurements though it was not statistically significant. There is a tendency to increase both mean systolic and diastolic blood pressure measurements as the body mass index increases. Similarly, findings from different settings also showed that as the BMI increases there is an increase in blood pressure, but none of these studies demonstrated the association between underweight and high blood pressure (13-16).
The disagreement between our findings and others may partly be explained by the fact that our study subjects are from low socioeconomic group with few cases of obesity and overweight.
The mean systolic blood pressure of 116 mmHg and mean diastolic blood pressure of 62 mmHg is remarkably low as compared with previous reports (17) but is similar with the Zurich study that showed significantly lower mean systolic and diastolic blood pressure records (18).
There are varied reports concerning the relationship between gender and high BP; some reported higher levels in males (19) others in females (20-22) and some reported no gender difference (23-27). Our study did not show gender difference in blood pressure measurements.
105 (15%) of our study subjects were underweight and 77 (11%) were stunted. Linear growth is affected when there is no adequate protein supply in the fastest period of growth in early life and this result might be an indicator of past or ongoing protein deficiency or both. Our study is a single-point cross-sectional measurement of blood pressure which is insufficient to determine high BP especially in children who may have high BP because of anxiety or excitement.
The fourth report on the diagnosis, evaluation, and treatment of high blood pressure in children and adolescents recommends repeated measurements of blood pressure three or more times in different occasions before charactering a child to be hypertensive. A single blood pressure measurement is the limitation of our study.
It can be concluded that hypertension is not uncommon among school children. It is also clear that none of them have been diagnosed as hypertensive. In addition, it can be noted that malnutrition is a major public health problem. Though there is no association found between hypertension and underweight; we recommend that routine BP measurement is critical in any clinical encounter of school children and attention be given to nutritional problems among school children.
Competing interests
The author(s) declare that they have no competing interests.
Authors Information
DS (MD, Pediatrician): Associate professor, Department of Pediatrics and Child Health, School of Medicine, college of Health Sciences, Addis Ababa University, Ethiopia
AM (MD, MSc): Professor, Department of Pediatrics and Child Health, School of Medicine, college of Health Sciences, Addis Ababa University, Ethiopia
WA (Bsc, Msc), Lecturer at School of Public Health, College of Health Sciences in Addis Ababa University, Ethiopia
Acknowledgments
We would like to thank the Ethiopian Pediatric Society for funding this project. We would also like to thank the Urban Development Office of Gulele Sub-city, School directors of Tsehay Choora, Eyerusalem and Atse Neakuto Le-ab schools for their unreserved support during the study.
- 1.Sinaik AR. Hypertension in children (1996). N Engl J Med.; 335(26): 1968-73.
- 2.Manger RG, Prineas RJ, Gomez- Maria O. Persistent elevation of blood pressure among children with a family history of hypertension: the Mineapolis Childrens Blood Pressure Study (1988). J. Hypertens.; 6(8): 647-53.
- 3.National High Blood Pressure Education Program Working Group on High Blood Pressure in Children and Adolescents. (2004).The fourth report on the diagnosis, evaluation, and treatment of high blood pressure in children and adolescents. 114(2 Suppl):555-76.
- 4.Mathew L.Hansen, Paul W.Gunn, David C.Kaelber (2007). Under diagnosis of hypertension in children and adolescents. JAMA 298(8): 874-79.
- 5.Zhang CX, Shi JD, Huang HY, Feng LM, Ma J (2012). Nutritional status and its relationship with blood pressure among children and adolescents in South China. Eur J Pediatr 171(7): 1073-9.
- 6.Sesso R, Barreto GP, Neves J, Sawaya AL. (2004). Malnutrition is associated with increased blood pressure in childhood. Nephron, Clin Pract 97(2): c61-6.
- 7.WHO Multicenter Growth Reference Study Group (2006). WHO Child Growth Standards: Length/height-for-age, weight-for-age, weight-for-length, weight-for-height and body mass index-for-age: Methods and development. Geneva: World Health Organization
- 8.Urrutia-Rojas X, Egbuchunam CU, Bae S, Menchaca J, Bayona M, Rivers PA, Singh KP (2006). High blood pressure in school children: prevalence and risk factors. BMC Pediatrics 6:32 (http:/www.biomedcentral.com/1471-2431/6/32.
- 9.Lauer RM, Clarke WR (1984). Childhood risk factors for high adult blood pressure: the Muscatine Study. Pediatrics 84:633-641.
- 10.Rames L, Clarke W, Connor W (1978). Normal blood pressures and the evaluation of sustained blood pressure elevation in childhood: The Muscatine Study. Pediatrics 61:245-51.
- 11.Cervantes J, Acoltzin C, Aguayo A (2000). Diagnosis and prevalence of high blood pressure in children aged under 19 in Colima City. Salud Publica de M?xico 42:529-532.
- 12.Goon D, Amusa L, Mhlongo D ,Khoza L, Any-anwu F (2013). Elevated Blood Pressure among Rural South African Children in Thohoyandou, South Africa. Iranian J Publ Health 42(5):489-96
- 13.Ulbak J, Lauritzen L, Hansen HS, Michaelsen KF (2004). Diet and blood pressure in 2.5 year-old Danish Children. Am Clin Nutr 79(6):1095-102.
- 14.J J Andy, G O Ladipo , S P Owolabi , S O Teniola , A A Ajayi , N O Akinola , O Morakinyo (1985). Blood pressure distribution of Nigerians in the first two decades of life. Ann Trop Paediatr 5:113-8
- 15.F Akor, S N Okolo, A A Okolo (2010). Blood pressure and anthropometric measurements in healthy primary school entrants in Jose, Nigeria.SAJCH 2(4):41-5
- 16.Agyemang C, Redekop WK, Owusu-Dabo E, Bruijnzeels MA. Blood pressure patterns in rural, semi-urban and urban children in the Ashanti region of Ghana, West Africa. http://www.biomedcentral.com/1471-2458/5/114
- 17.Ashrafi MR, Abdollahi M, Ahranjani BM, Shabanian R. (2005). Blood pressure distribution among healthy schoolchildren aged 6-13 years in Tehran. East Mediterr Health J. Spt-Nov; 11 (5-6):968-76
- 18.Leumann EP, Bodmer HG, Vetter W, Epstein FH (1981). Blood pressure study in school-children of Zurich.I. Results in the age group 7 to 12 years. Schweiz Med Wochenschr. 111(5):161-8 (article in German-indexed for MEDLINE)
- 19.OO Ogunkunle, Odutola AO, Orimadegun AE (2007). Pattern of Blood Pressure in apparently Healthy Nigerian Children aged 1-5 years. Nigerian Journal of Paediatrics 34 (1 and2): 14-23.TWO issues but one set of pages???
- 20.Kotchen JM, Kotchen Ta, Schwertman NC, Kuller LH (1974). Blood pressure distribution of urban adolescents. Am J Epidemiol 99:315-24.
- 21.Oli K, Tekle-Haimanot R, Forsgren L, Ekstedt J (1994). Blood pressure patterns and its correlates in schoolchildren of an Ethiopian community. J Trop Pediatr 40: 100-3.
- 22.Blankson JM, Larbi EB, Pobee JOM (1977). Blood pressure level of African children. J Chron Dis 30: 735-43.
- 23.Antia AU, Maxwell R, Gough A, Ayeni O (1980). Arterial blood pressures in Jamaican Children of negro descent. West Indian Med. J 29:110-6
- 24.Melby CL, Dunn PJ, Hyner GC, et al (1987). Correlates of blood pressure in elementary schoolchildren. J Sch Health 57-375-8.
- 25.Khan IA, Gajaria M, Stephens D, Balfe JW (2000). Ambulatory blood pressure monitoring in children: a large centers experience. Pediatr Nephrol 14: 802-5.
- 26.Sorof MJ, Lai D, Turner J, Poffenbarger T, Portman JR (2004). Overweight, Ethnicity, and the Prevalence of Hypertension in School-Aged Children. Pediatrics 113; 475-82.
- 27.Shear CL, Freedman DS, Burke GL (1987): Body fat Patterning and blood pressure in Children and young adults. The Bogalusa Heart Study. Hypertension 9:236-244.
- Mekasha A, Zerfu M (2009). Prevalence of anemia among school children in Addis Ababa. Ethiop Med J 47 (2): 129-133
TABLES:
TABLE 1: Age and anthropometric characteristics of children in three public schools, Addis Ababa

TABLE 2: The diastolic and systolic BP measurement and internal validation (Cronbachs ? coefficient)
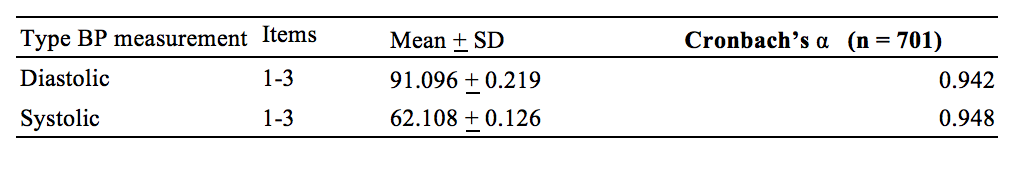
TABLE 3: Demographic and Nutritional characteristics of study subjects in relation to their diastolic blood pressure in three public schools in Addis Ababa, Ethiopia, 2013

TABLE 4: Prevalence and unadjusted and adjusted Odds ratios* of hypertension** by physical characteristics, Addis Ababa, Ethiopia, 2013

Additional Info
-
Language:
English -
Contains Audio:
No -
Content Type:
Articles -
Source:
ISN -
Year:
2016 -
Members Only:
No